


Bitcoin (BTC) is navigating a critical phase in September 2025, balancing between bullish technical signals and cautious market behavior influenced by whale activity and macroeconomic uncertainties. Trading near $112,000, BTC shows potential for a rally toward $120,000, while some resistance and selling pressure suggest a mixed near-term outlook. This article combines a detailed market analysis of top five indicators with recent news and forecasts to offer a comprehensive view of BTC’s trajectory and key factors affecting its price.
#1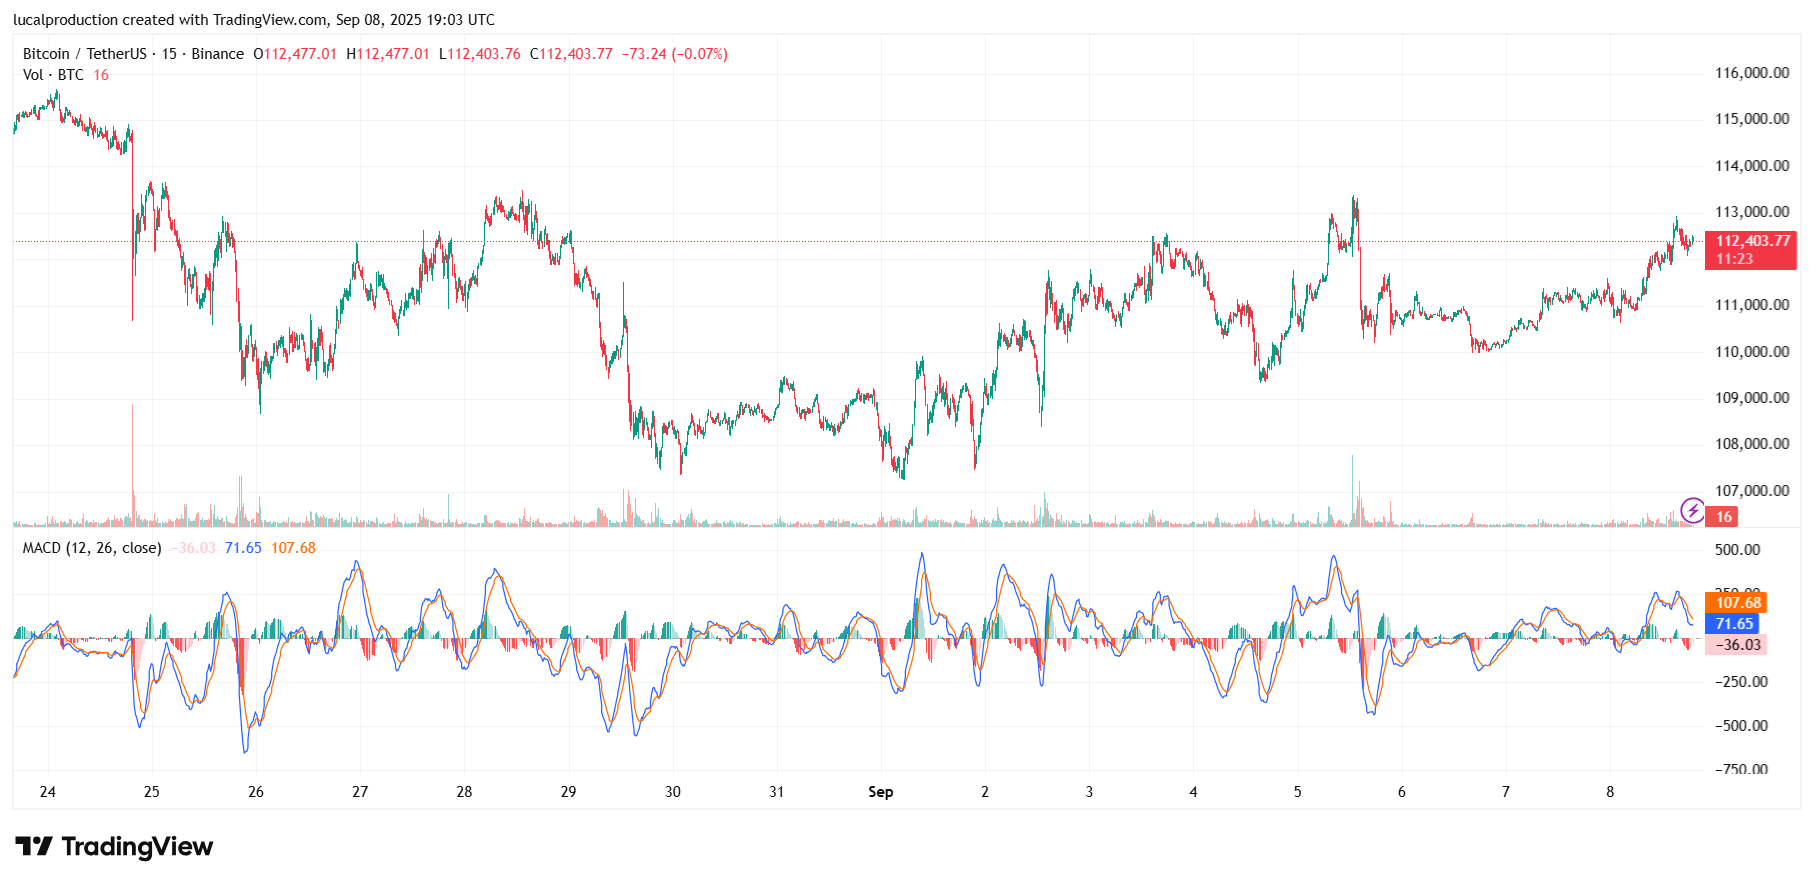 Bitcoin is trading around $112,000 as of September 8, 2025, showing signs of tentative recovery following a recent correction. The asset has been range-bound between $107,500 and $120,000 since July, demonstrating cautious sentiment among investors. Whale sell-offs, the largest since mid-2022, have tempered the upside, with over 110,000 BTC sold in the last month. Meanwhile, institutional demand from treasury companies has slowed, though robust fundamentals remain intact. Traders are watching critical support around $100,000 and resistance near $115,000 closely as BTC navigates this consolidation phase.
Bitcoin’s Current Market Overview and Price Position
Bitcoin is trading around $112,000 as of September 8, 2025, showing signs of tentative recovery following a recent correction. The asset has been range-bound between $107,500 and $120,000 since July, demonstrating cautious sentiment among investors. Whale sell-offs, the largest since mid-2022, have tempered the upside, with over 110,000 BTC sold in the last month. Meanwhile, institutional demand from treasury companies has slowed, though robust fundamentals remain intact. Traders are watching critical support around $100,000 and resistance near $115,000 closely as BTC navigates this consolidation phase.
#2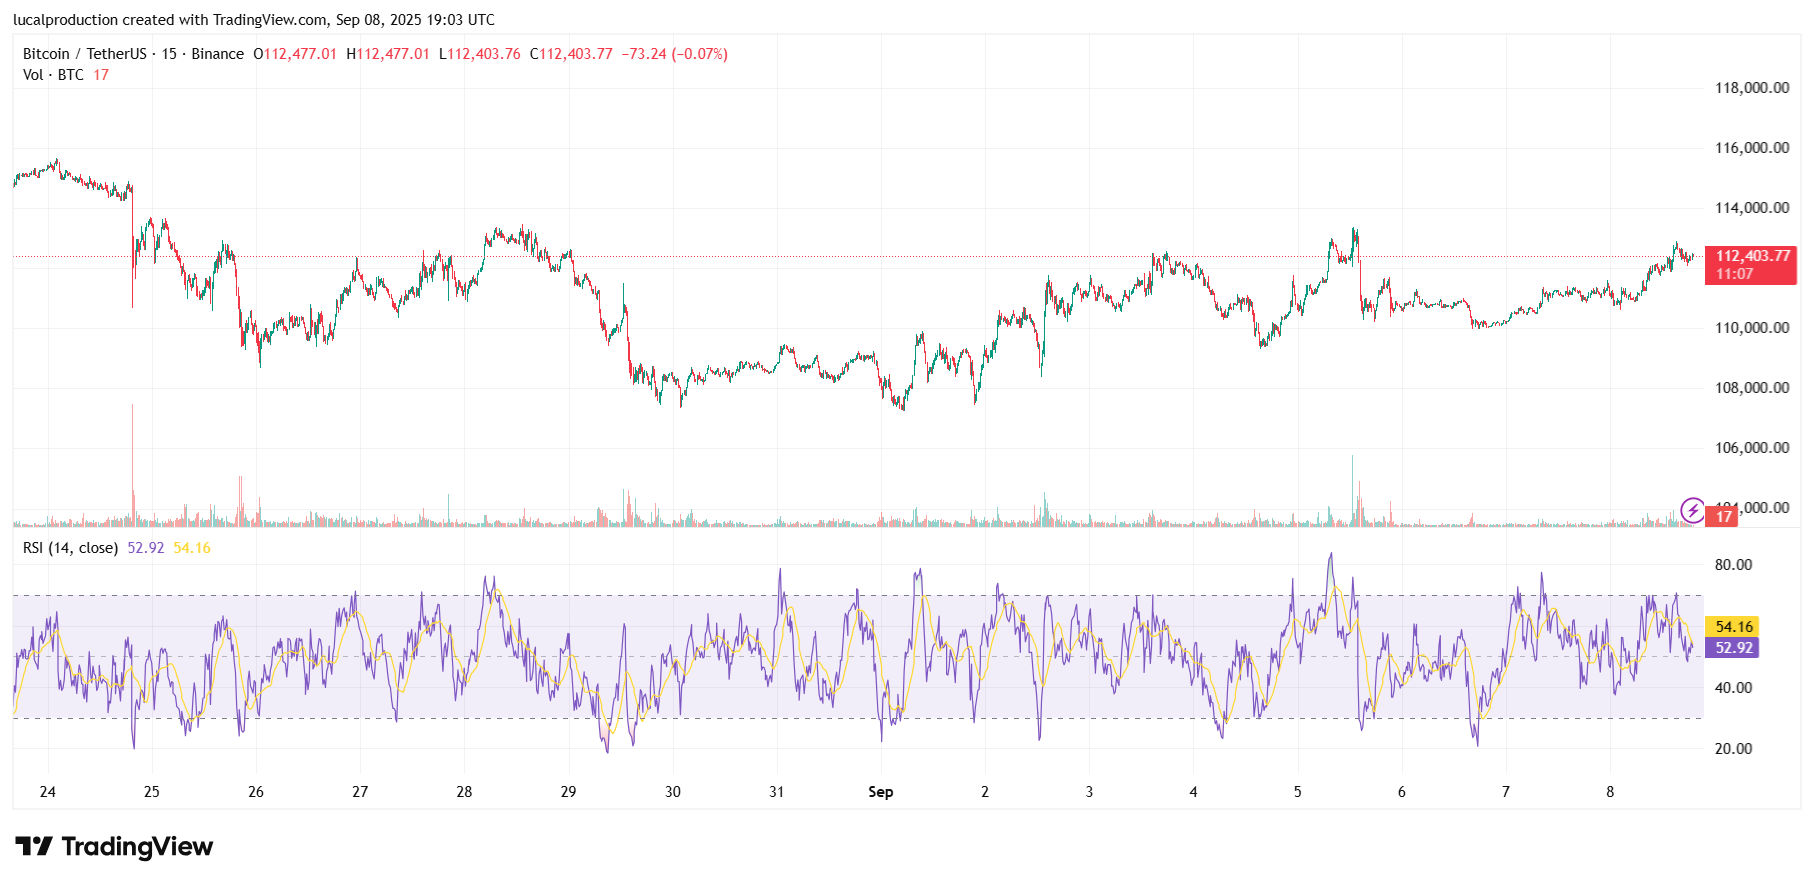 Moving Averages (50-day and 200-day): BTC has broken above the 20-day EMA ($111,900), suggesting short-term bullish momentum. Resistance awaits at the 50-day SMA near $114,900, where sellers are expected to challenge gains.
Relative Strength Index (RSI): Sitting near 55, the RSI indicates moderate bullish strength but not overbought conditions, leaving space for further upside.
MACD (Moving Average Convergence Divergence): A bullish crossover supports momentum toward higher prices, aligning with a potential rally.
Bollinger Bands: BTC price currently trades within the middle bands, signaling consolidation with potential volatility spikes as the price approaches resistance.
Volume Trends: Whale selling activity has pressured volumes, but moderate buying at support levels is providing balance. Volume patterns suggest a range-bound market likely until a breakout occurs.
Top Five Technical Indicators and Chart Analysis of BTC
Moving Averages (50-day and 200-day): BTC has broken above the 20-day EMA ($111,900), suggesting short-term bullish momentum. Resistance awaits at the 50-day SMA near $114,900, where sellers are expected to challenge gains.Relative Strength Index (RSI): Sitting near 55, the RSI indicates moderate bullish strength but not overbought conditions, leaving space for further upside.
MACD (Moving Average Convergence Divergence): A bullish crossover supports momentum toward higher prices, aligning with a potential rally.
Bollinger Bands: BTC price currently trades within the middle bands, signaling consolidation with potential volatility spikes as the price approaches resistance.
Volume Trends: Whale selling activity has pressured volumes, but moderate buying at support levels is providing balance. Volume patterns suggest a range-bound market likely until a breakout occurs.
#3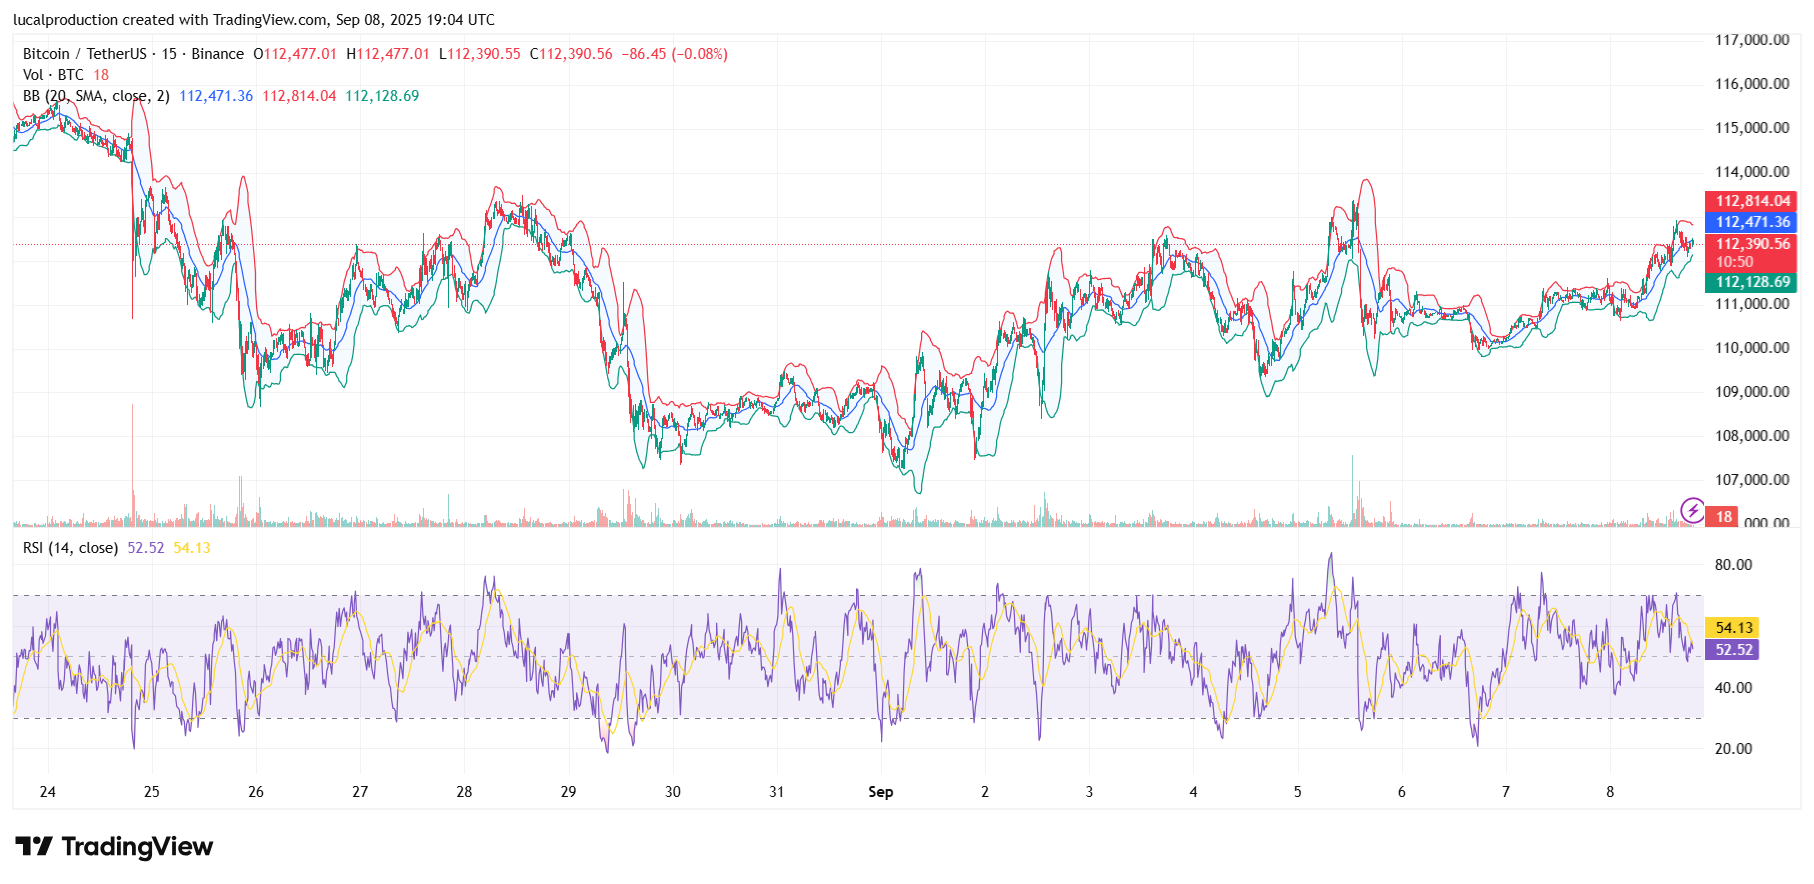 News around Bitcoin centers on mixed institutional flows and significant Federal Reserve interest rate decisions looming mid-September. Whale selling is placing near-term pressure on prices, while influential figures like Michael Saylor project BTC climbing past $150,000 by year-end. The global macroeconomic backdrop remains uncertain, especially with the Fed’s upcoming rate decision, which could trigger substantial volatility. Additionally, regulatory clarity and increased adoption as digital gold bolster Bitcoin's long-term fundamentals.
Recent News Impacting Bitcoin’s Outlook
News around Bitcoin centers on mixed institutional flows and significant Federal Reserve interest rate decisions looming mid-September. Whale selling is placing near-term pressure on prices, while influential figures like Michael Saylor project BTC climbing past $150,000 by year-end. The global macroeconomic backdrop remains uncertain, especially with the Fed’s upcoming rate decision, which could trigger substantial volatility. Additionally, regulatory clarity and increased adoption as digital gold bolster Bitcoin's long-term fundamentals.
#4
BTC Price Predictions and Future Market Outlook
Experts predict short-term price movement to remain range-bound between $107,000 and $115,000, with a critical breakout needed above $115,000 for a push toward $120,000. A break below $107,000 could lead to testing support levels near $100,000. Advanced AI models forecast a slight 1.7% dip over the next month, but overall market sentiment favors volatility spikes and a bullish rebound toward end of September. Quarter 4 2025 is generally expected to carry a bullish bias if institutional demand revives and macro conditions stabilize.
#5
Key Focus Areas for Traders Going Forward
Traders should monitor the 50-day SMA and $115,000 resistance zone closely for breakout signals. RSI and MACD crossovers will provide critical momentum confirmations. Volume behavior, especially whale transactions and institutional buying, should guide entry and exit decisions. Macro events like the Federal Reserve’s rate announcement on September 17 will be a pivotal catalyst potentially driving major price swings.
#6
Key technical indicators point to potential bullish momentum with resistance around $115,000.
Federal Reserve decisions and macroeconomic factors create high volatility risk approaching mid-September.
Advanced models predict moderate dips offset by possible late-month volatility spikes.
Traders should watch moving averages, RSI, MACD, volume, and key price levels for direction.
Key Takeaways
Bitcoin remains in a consolidation range near $112,000 amid caution from whales and institutions.Key technical indicators point to potential bullish momentum with resistance around $115,000.
Federal Reserve decisions and macroeconomic factors create high volatility risk approaching mid-September.
Advanced models predict moderate dips offset by possible late-month volatility spikes.
Traders should watch moving averages, RSI, MACD, volume, and key price levels for direction.
#7


