


Solana (SOL) is capturing attention in August 2025 with a blend of strong technical momentum and positive ecosystem news. After reclaiming key support and surpassing critical resistance levels, SOL demonstrates promising short- and mid-term potential. This article analyzes Solana’s price action using five top indicators, explores recent news driving investor optimism, and offers a balanced price outlook. With volatility present, the evolving market setup suggests both opportunities and caution for traders and investors alike.
#1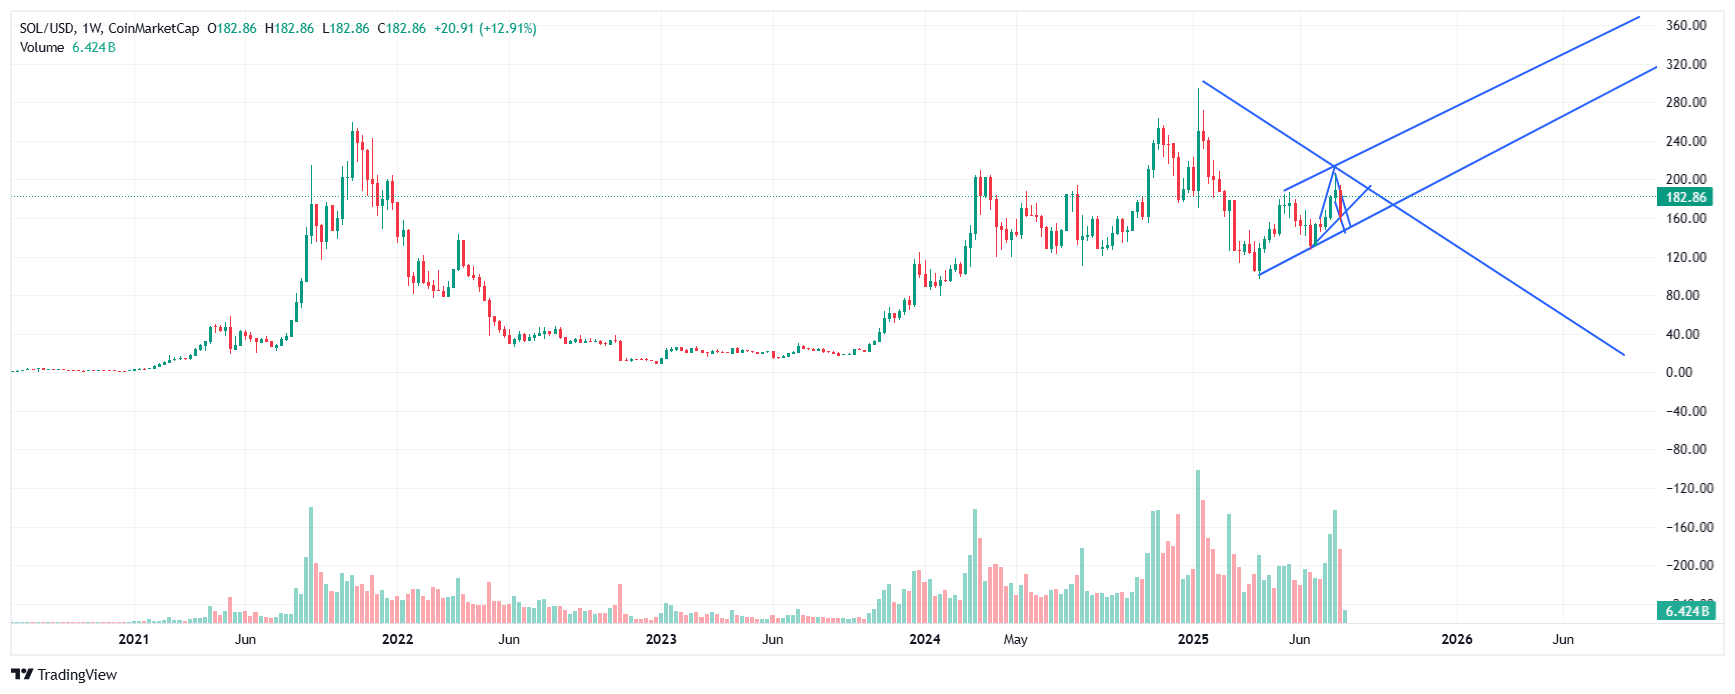 Solana has climbed significantly, trading around $182-$183 after a surge from key support near $160-$165 earlier in August.
This rally followed a strong defense of support levels and a 14% price jump in just days, partly fueled by $1.4 billion worth of SOL staking withdrawals that increased the circulating supply and activated short-term trading interest.
Whale activity remains notable, signaling institutional confidence. Resistance sits near $189 and $200, levels critical for unlocking further upside.
The Relative Strength Index (RSI) is around 55, reflecting a balanced momentum without overbought pressure, implying room for growth but vigilance for volatility is necessary.
Solana’s Current Market Landscape
Solana has climbed significantly, trading around $182-$183 after a surge from key support near $160-$165 earlier in August. This rally followed a strong defense of support levels and a 14% price jump in just days, partly fueled by $1.4 billion worth of SOL staking withdrawals that increased the circulating supply and activated short-term trading interest.
Whale activity remains notable, signaling institutional confidence. Resistance sits near $189 and $200, levels critical for unlocking further upside.
The Relative Strength Index (RSI) is around 55, reflecting a balanced momentum without overbought pressure, implying room for growth but vigilance for volatility is necessary.
#2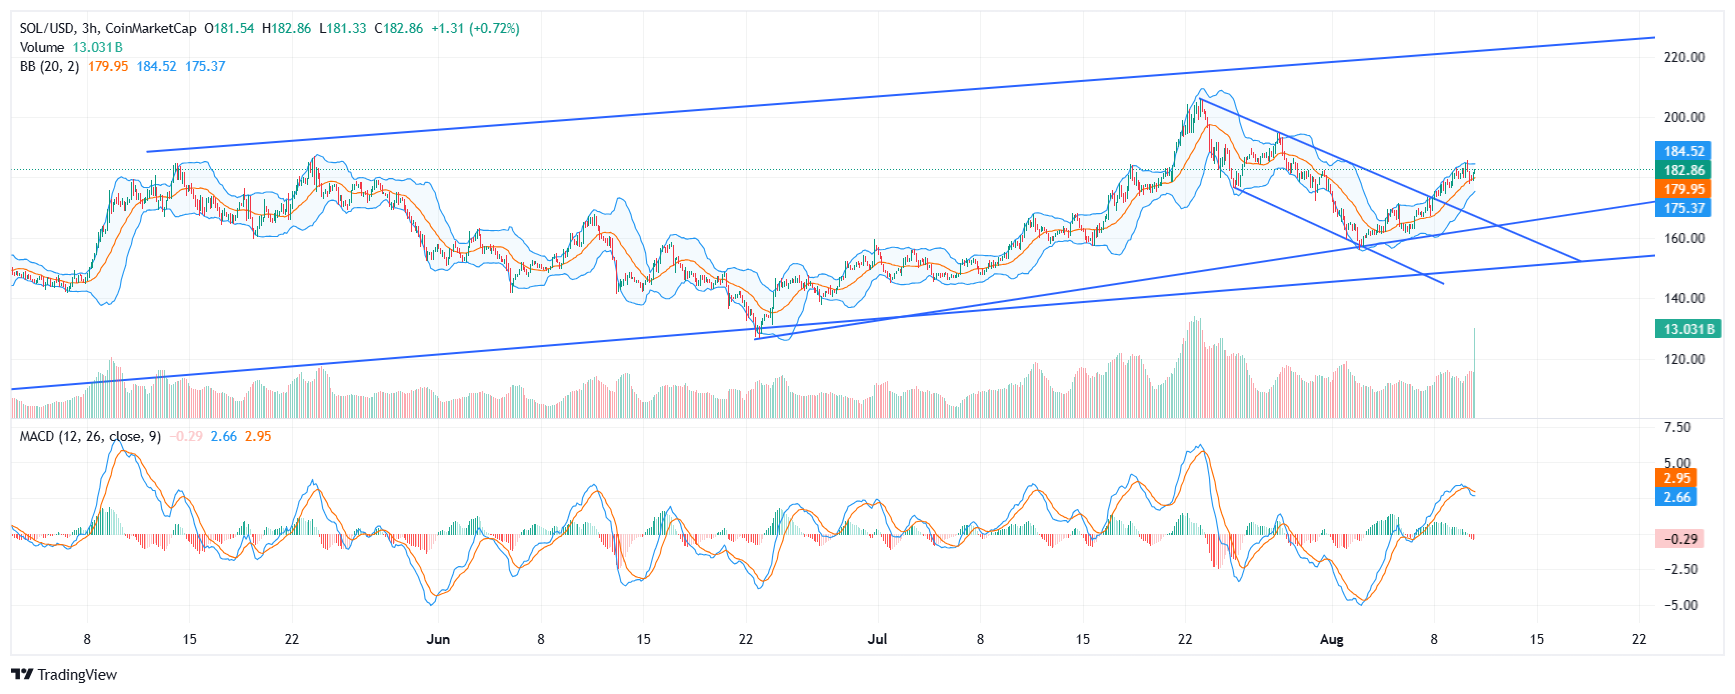 A thorough review through key indicators reveals:
RSI (Relative Strength Index) at about 55 suggests neither overbought nor oversold conditions; a neutral stance supporting further upside potential.
50-day Simple Moving Average (SMA) is trending near $165, serving as strong short-term support and endorsing the current bullish channel.
200-day SMA at about $157 indicates robust longer-term support, with rising averages signaling sustained upward momentum.
MACD (Moving Average Convergence Divergence) displays a bullish crossover, highlighting growing buying pressure and confirming upward momentum.
Bollinger Bands show that price is approaching the upper band, which means momentum is strong but could also signal upcoming volatility or a minor pullback.
Together, these indicators paint a generally bullish picture but caution calls for monitoring potential short-term corrections driven by volatility.
Five Technical Indicators Shaping Solana’s Price Action
A thorough review through key indicators reveals:RSI (Relative Strength Index) at about 55 suggests neither overbought nor oversold conditions; a neutral stance supporting further upside potential.
50-day Simple Moving Average (SMA) is trending near $165, serving as strong short-term support and endorsing the current bullish channel.
200-day SMA at about $157 indicates robust longer-term support, with rising averages signaling sustained upward momentum.
MACD (Moving Average Convergence Divergence) displays a bullish crossover, highlighting growing buying pressure and confirming upward momentum.
Bollinger Bands show that price is approaching the upper band, which means momentum is strong but could also signal upcoming volatility or a minor pullback.
Together, these indicators paint a generally bullish picture but caution calls for monitoring potential short-term corrections driven by volatility.
#3 Solana’s price pattern on the chart reveals a textbook “inverse head and shoulders” formation, a reliable bullish reversal signal that suggests a sustained rally ahead if resistance levels break decisively.
The token has rallied above the 20-day moving average, further confirming positive momentum. Price action is currently challenged by resistance zones at $189 and $200.
A solid breakout past these barriers with increasing trading volume would validate a bullish trend continuation. Conversely, failure to breach these could lead to a retracement toward support around $165-$170. Trading volumes remain key to confirming strength and sustaining the upward push.
Market Chart Analysis and Price Patterns
Solana’s price pattern on the chart reveals a textbook “inverse head and shoulders” formation, a reliable bullish reversal signal that suggests a sustained rally ahead if resistance levels break decisively.The token has rallied above the 20-day moving average, further confirming positive momentum. Price action is currently challenged by resistance zones at $189 and $200.
A solid breakout past these barriers with increasing trading volume would validate a bullish trend continuation. Conversely, failure to breach these could lead to a retracement toward support around $165-$170. Trading volumes remain key to confirming strength and sustaining the upward push.
#4 Recent developments influencing Solana’s price and market sentiment include:
Staking Withdrawals Impact: Over $1.4 billion worth of SOL was withdrawn from staking pools in early August, increasing circulating supply and fueling speculative activity, coinciding with a rapid price rise.
Network Growth and Upgrades: Solana continues to enhance its network capabilities, focusing on scalability and low transaction costs, driving increased developer activity and DApp deployments.
Institutional Interest: Whale accumulation remains strong, reflecting renewed institutional confidence despite broader crypto volatility.
Ecosystem Expansion: Partnerships and integration with DeFi projects and NFT platforms sustain Solana’s role as a major blockchain ecosystem.
General Market Trends: Bitcoin and Ethereum stability enhances altcoin market sentiment, indirectly supporting SOL’s uptrend.
These factors collectively underpin the bullish thesis while reminding investors of potential short-term risks due to market dynamics.
Recent News Impacting Solana’s Momentum
Recent developments influencing Solana’s price and market sentiment include:Staking Withdrawals Impact: Over $1.4 billion worth of SOL was withdrawn from staking pools in early August, increasing circulating supply and fueling speculative activity, coinciding with a rapid price rise.
Network Growth and Upgrades: Solana continues to enhance its network capabilities, focusing on scalability and low transaction costs, driving increased developer activity and DApp deployments.
Institutional Interest: Whale accumulation remains strong, reflecting renewed institutional confidence despite broader crypto volatility.
Ecosystem Expansion: Partnerships and integration with DeFi projects and NFT platforms sustain Solana’s role as a major blockchain ecosystem.
General Market Trends: Bitcoin and Ethereum stability enhances altcoin market sentiment, indirectly supporting SOL’s uptrend.
These factors collectively underpin the bullish thesis while reminding investors of potential short-term risks due to market dynamics.
#5
In the short term, SOL could target the $189-$200 resistance zone, with price appreciation in the range of 3-5% from current levels if momentum holds.
Mid-term projections suggest a climb toward $225 if Solana breaks out above the $200 level with volume confirmation, aligning with optimistic analyst scenarios.
Pullbacks to the $165-$170 support range are viewed as buying opportunities, serving as critical price floors in case of short-term profit-taking or market dips.
Long-term prospects remain positive, with some analysts projecting SOL could reach upwards of $800 by the end of 2025, assuming continued network growth and positive market conditions.
Careful position management and attention to volume and resistance breaks are emphasized to navigate the volatile landscape.
Price Predictions and Future Outlook
Forecasting Solana’s near and mid-term price trajectory:In the short term, SOL could target the $189-$200 resistance zone, with price appreciation in the range of 3-5% from current levels if momentum holds.
Mid-term projections suggest a climb toward $225 if Solana breaks out above the $200 level with volume confirmation, aligning with optimistic analyst scenarios.
Pullbacks to the $165-$170 support range are viewed as buying opportunities, serving as critical price floors in case of short-term profit-taking or market dips.
Long-term prospects remain positive, with some analysts projecting SOL could reach upwards of $800 by the end of 2025, assuming continued network growth and positive market conditions.
Careful position management and attention to volume and resistance breaks are emphasized to navigate the volatile landscape.
#6
Key technical indicators (RSI, moving averages, MACD, Bollinger Bands) confirm an uptrend but signal caution due to potential short-term volatility.
Critical resistance levels at $189 and $200 will determine the next phase; breaking through may open the door to $225 and beyond.
Recent news on network development and institutional interest adds strength to the outlook.
Pullbacks near $165-$170 offer attractive entry points within the broader bullish trend.
Key takeaways
Solana is showing strong bullish momentum in August 2025, supported by solid technical indicators and significant staking withdrawals.Key technical indicators (RSI, moving averages, MACD, Bollinger Bands) confirm an uptrend but signal caution due to potential short-term volatility.
Critical resistance levels at $189 and $200 will determine the next phase; breaking through may open the door to $225 and beyond.
Recent news on network development and institutional interest adds strength to the outlook.
Pullbacks near $165-$170 offer attractive entry points within the broader bullish trend.
#7
Is Solana a good buy now? Technical indicators are favorable, but potential short-term corrections suggest entering positions with caution.
What risks exist? Market volatility, resistance challenges, and potential oversupply following staking withdrawals.
How does Solana stand out? It offers high throughput with low fees, attracting developers and users to its expanding ecosystem.
What are realistic price targets? $189-$200 near term, with potential to reach $225 and even $800 under optimistic scenarios by year-end.
FAQ
What’s driving Solana’s recent price surge? Large staking withdrawals, increased whale activity, network upgrades, and broad market support.Is Solana a good buy now? Technical indicators are favorable, but potential short-term corrections suggest entering positions with caution.
What risks exist? Market volatility, resistance challenges, and potential oversupply following staking withdrawals.
How does Solana stand out? It offers high throughput with low fees, attracting developers and users to its expanding ecosystem.
What are realistic price targets? $189-$200 near term, with potential to reach $225 and even $800 under optimistic scenarios by year-end.
#8
Moving Forward: Solana’s 2025 Growth Potential
Solana’s blend of technical strength and fundamental developments underpin a promising outlook for 2025. While watching resistance and volume closely, investors may find attractive opportunities in correction dips. The ongoing ecosystem expansion and strategic network upgrades continue to position SOL as a leading player ready for future growth and adoption.
#9
Disclaimer
The information provided is NOT financial advice. I am not a financial adviser, accountant or the like. This information is purely from my own due diligence and an expression of my thoughts, my opinions based on my personal experiences and the help from technology information gathering tools to indicate the movement of the market, coin or any relevant information which is human changed and reedited.Reactions
Reactions
2


