


XRP is at a turning point in August 2025 as technical indicators and market dynamics suggest a tense battle between bulls and bears. Following a strong rally after Ripple’s SEC settlement, XRP now faces profit-taking and key support tests which will determine its near-term direction. This analysis dives into XRP’s chart using five top technical indicators, current news impacting the token, and expert price predictions that can guide investors navigating this critical phase.
#1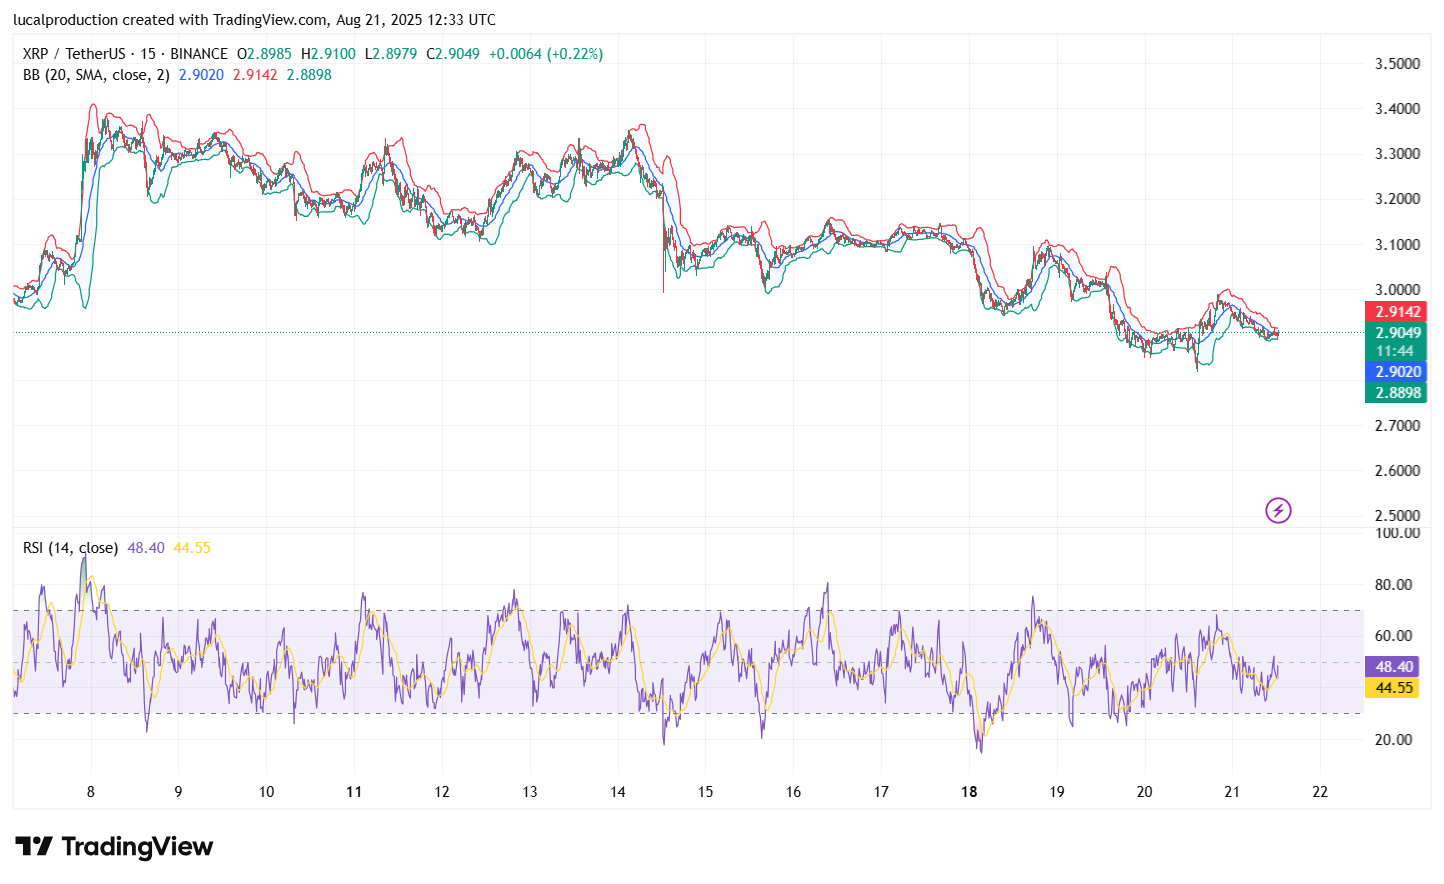 XRP came off highs near $3.66 but has slipped below a critical support band at roughly $2.96-$3.00. This breakdown increases the chance of a deeper dip potentially toward the early August low near $2.73 or even the May peak at $2.65. The token is trying to stabilize around its 55-day simple moving average at roughly $2.90. Despite the pullback, medium-term uptrend holds if key lows prevent further slide. Institutional volume remains strong though profit-taking pressures triggered a four-session decline.
XRP’s Recent Market Behavior
XRP came off highs near $3.66 but has slipped below a critical support band at roughly $2.96-$3.00. This breakdown increases the chance of a deeper dip potentially toward the early August low near $2.73 or even the May peak at $2.65. The token is trying to stabilize around its 55-day simple moving average at roughly $2.90. Despite the pullback, medium-term uptrend holds if key lows prevent further slide. Institutional volume remains strong though profit-taking pressures triggered a four-session decline.
#2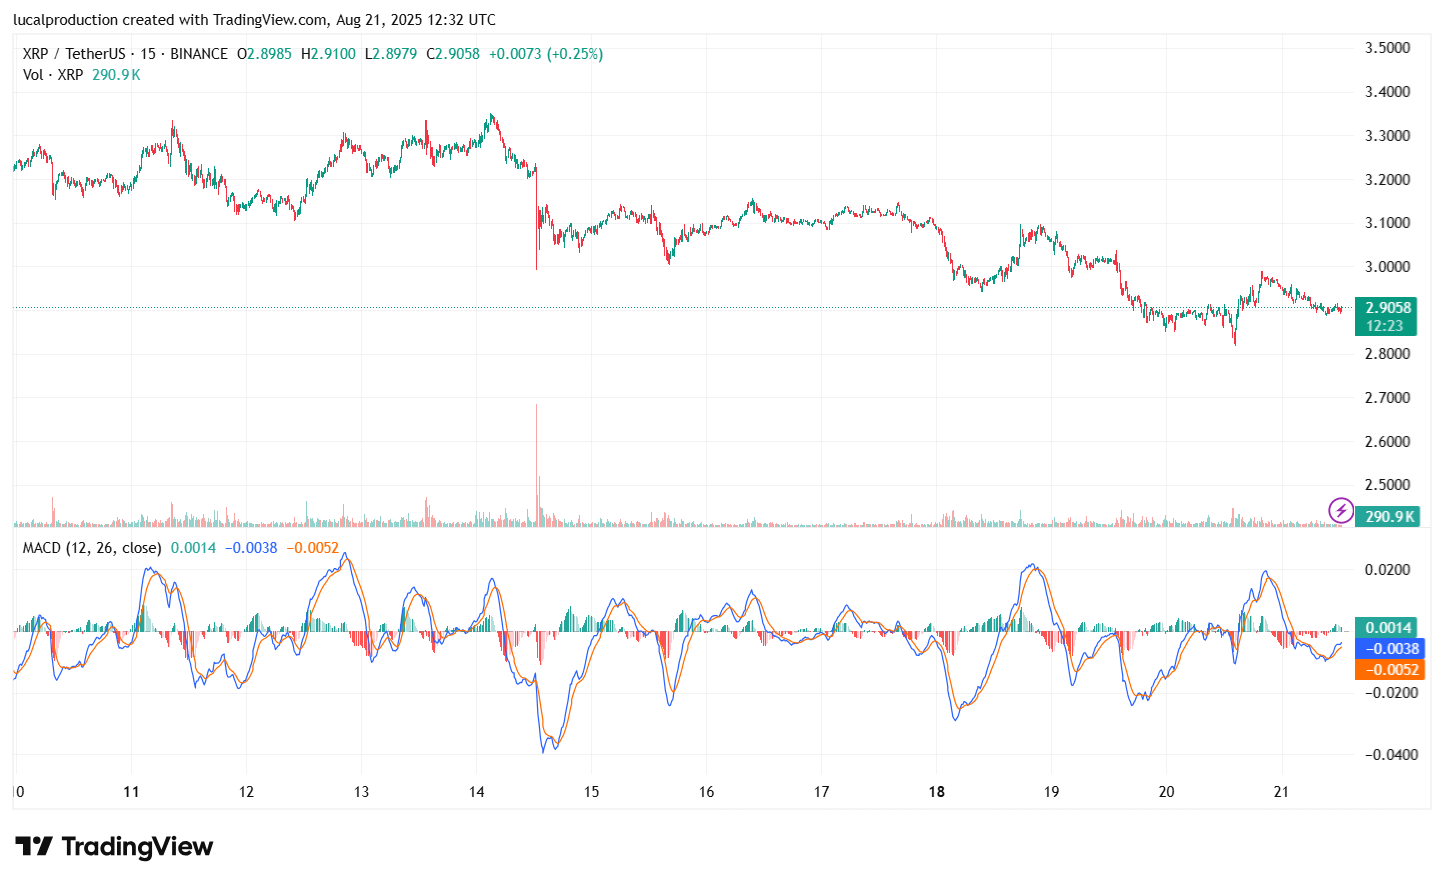 Key technical tools reveal insights on XRP’s direction:
Moving Averages: The price fell below the 20-day and 50-day moving averages, now testing the 55-day SMA for support, signaling short-term bearish pressure but not a complete trend reversal yet.
Relative Strength Index (RSI): Trading around 45-52, the RSI shows indeterminate momentum, with recent bearish divergence warning of waning bull strength.
MACD: Approaching a bearish crossover after recent highs, hinting at weakening upward momentum.
Support and Resistance Levels: Critical support zones sit at $2.90, $2.73 (early August low), and $2.65 (May peak). Resistance clusters near $3.20, $3.31 (23.6% Fibonacci retracement), and higher peaks from July-August.
Aroon Indicator: The Aroon Down at 93% vs. Aroon Up near 7% illustrates strong bearish trend dominance in the short term.
These indicators together point to a cautious outlook where failure to hold support could deepen losses, and reclaiming resistance zones would be key to a bullish momentum shift.
Five Top Indicators Decoding XRP’s Chart
Key technical tools reveal insights on XRP’s direction:Moving Averages: The price fell below the 20-day and 50-day moving averages, now testing the 55-day SMA for support, signaling short-term bearish pressure but not a complete trend reversal yet.
Relative Strength Index (RSI): Trading around 45-52, the RSI shows indeterminate momentum, with recent bearish divergence warning of waning bull strength.
MACD: Approaching a bearish crossover after recent highs, hinting at weakening upward momentum.
Support and Resistance Levels: Critical support zones sit at $2.90, $2.73 (early August low), and $2.65 (May peak). Resistance clusters near $3.20, $3.31 (23.6% Fibonacci retracement), and higher peaks from July-August.
Aroon Indicator: The Aroon Down at 93% vs. Aroon Up near 7% illustrates strong bearish trend dominance in the short term.
These indicators together point to a cautious outlook where failure to hold support could deepen losses, and reclaiming resistance zones would be key to a bullish momentum shift.
#3 Several factors influence XRP’s current market mood:
Profit-taking following the Ripple-SEC legal settlement’s initial price surge has contributed to recent drops.
Despite this, trading volumes remain elevated around $9 billion, reflecting ongoing institutional interest.
"Smart money" investors have reduced XRP holdings by about 80% over the last month, signaling potential caution among big players.
XRP’s open futures interest declined from $10.9 billion in July to $7.5 billion in August, hinting at reduced speculative fervor.
Regulatory headlines remain positive, with anticipation around potential ETFs and further clarifications keeping long-term interest intact.
Market News Driving XRP Price Action
Several factors influence XRP’s current market mood:Profit-taking following the Ripple-SEC legal settlement’s initial price surge has contributed to recent drops.
Despite this, trading volumes remain elevated around $9 billion, reflecting ongoing institutional interest.
"Smart money" investors have reduced XRP holdings by about 80% over the last month, signaling potential caution among big players.
XRP’s open futures interest declined from $10.9 billion in July to $7.5 billion in August, hinting at reduced speculative fervor.
Regulatory headlines remain positive, with anticipation around potential ETFs and further clarifications keeping long-term interest intact.
#4
Conservative forecasts expect XRP hovering between $2.80 and $3.10 through August and September 2025.
Mainstream predictions target a gradual rebound toward $4.00-$5.50 by the end of 2025 if market confidence returns.
Some analysts warn that falling below $2.90 support could open doors to lows near $2.40 or even $2.00 in bearish scenarios.
Recovery depends on XRP surpassing resistance around $3.20-$3.30 and holding sustained volume for a bullish breakout.
XRP Price Predictions and Forecasts
Expert views fall across a range, leaning cautious but optimistic:Conservative forecasts expect XRP hovering between $2.80 and $3.10 through August and September 2025.
Mainstream predictions target a gradual rebound toward $4.00-$5.50 by the end of 2025 if market confidence returns.
Some analysts warn that falling below $2.90 support could open doors to lows near $2.40 or even $2.00 in bearish scenarios.
Recovery depends on XRP surpassing resistance around $3.20-$3.30 and holding sustained volume for a bullish breakout.
#5
Price currently tests 55-day SMA support around $2.90.
Failing to hold could deepen pullback to low $2.70s or mid-$2.40s.
Bullish momentum requires reclaiming $3.20 and $3.31 resistance zones.
Lower volatility periods suggest consolidation before a decisive trend forms.
Watch MACD and RSI trends closely for momentum shifts.
Technical Outlook Summary & Key Levels
XRP’s chart signals a critical test phase:Price currently tests 55-day SMA support around $2.90.
Failing to hold could deepen pullback to low $2.70s or mid-$2.40s.
Bullish momentum requires reclaiming $3.20 and $3.31 resistance zones.
Lower volatility periods suggest consolidation before a decisive trend forms.
Watch MACD and RSI trends closely for momentum shifts.
#6
Strong but challenged medium-term bullish trend.
Technical indicators showing potential short-term weakness.
Elevated institutional volume and cautious positioning among “smart money.”
Predictions favor cautious optimism with critical support holding the line.
Price catalysts include regulatory news and ETF possibilities.
Key Takeaways
XRP faces pivotal market testing with:Strong but challenged medium-term bullish trend.
Technical indicators showing potential short-term weakness.
Elevated institutional volume and cautious positioning among “smart money.”
Predictions favor cautious optimism with critical support holding the line.
Price catalysts include regulatory news and ETF possibilities.
#7
Disclaimer
The information provided is NOT financial advice. I am not a financial adviser, accountant or the like. This information is purely from my own due diligence and an expression of my thoughts, my opinions based on my personal experiences and the help from technology information gathering tools to indicate the movement of the market, coin or any relevant information which is human changed and reedited.Reactions
Reactions
1


