


Polkadot (DOT) is on a cautious but steady recovery track in August 2025. The coin faces short-term fluctuations, yet a strong ecosystem and promising fundamentals support a potential upside. This article blends technical analysis using five top chart indicators with current market news, ecosystem developments, and price forecasts to paint a full picture of Polkadot’s near future. Investors and traders get a clear view of what the charts and news say about DOT’s next moves.
#1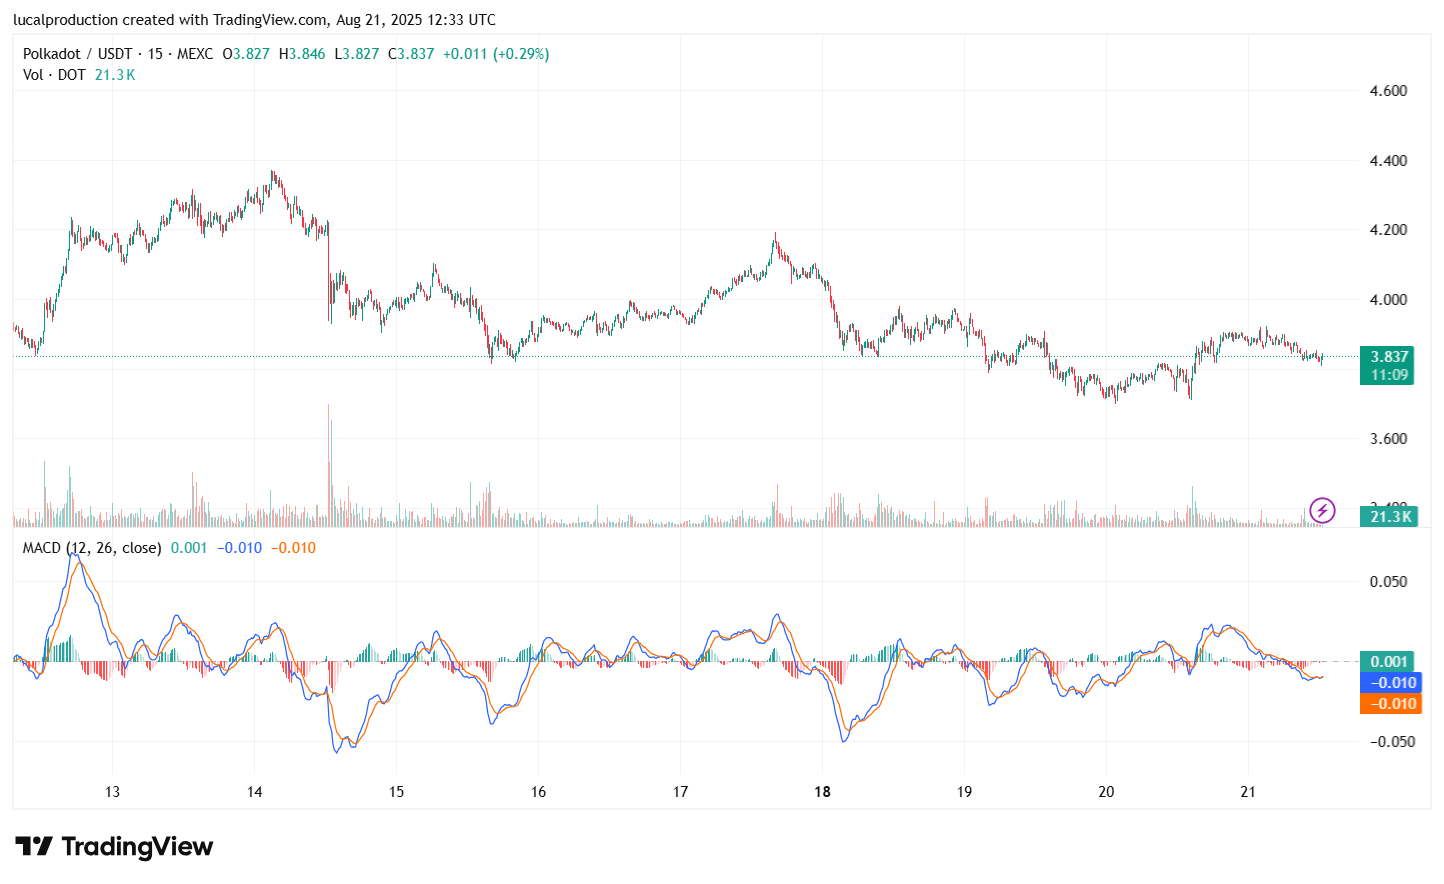 DOT’s price hovered around $3.70–$3.90 in the first three weeks of August, with a dip below $3.60 early in the month followed by a rebound to near $3.98. Trading volume remains healthy at around $390 million daily. Institutional interest and staking activity continue to support price stability. However, resistance near $4.15–$4.20 challenges upward momentum, while support holds firm around $3.60–$3.70. Overall, Polkadot is navigating short-term dips but maintaining potential for growth.
Polkadot’s Recent Market Movements
DOT’s price hovered around $3.70–$3.90 in the first three weeks of August, with a dip below $3.60 early in the month followed by a rebound to near $3.98. Trading volume remains healthy at around $390 million daily. Institutional interest and staking activity continue to support price stability. However, resistance near $4.15–$4.20 challenges upward momentum, while support holds firm around $3.60–$3.70. Overall, Polkadot is navigating short-term dips but maintaining potential for growth.
#2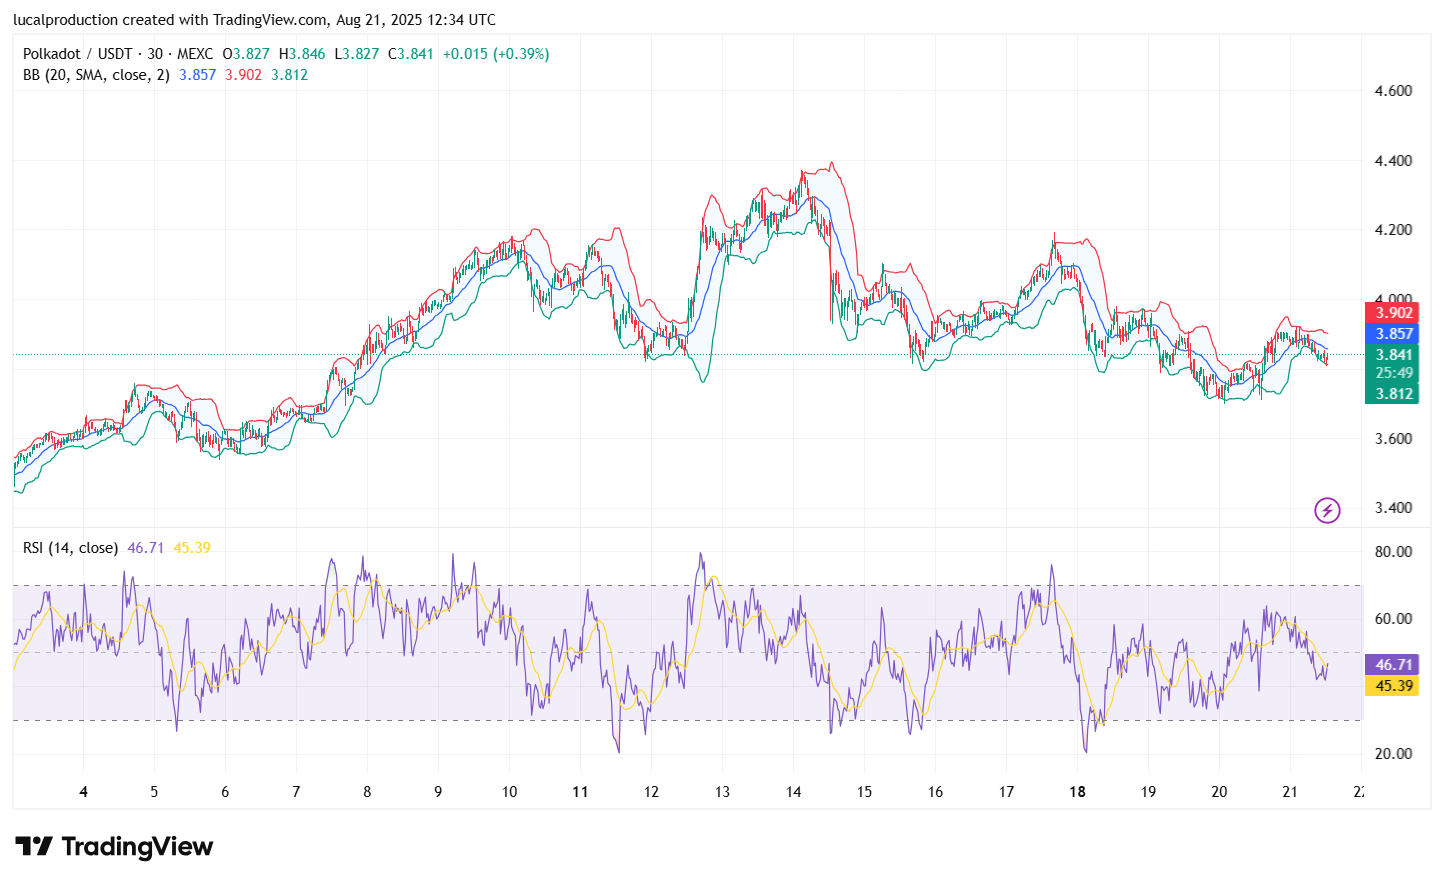 The crucial technical indicators reveal mixed signals with a lean towards cautious optimism:
Moving Averages (20-day and 50-day SMA): DOT is trading just above the 50-day SMA but below the 20-day, signaling some consolidation with upward bias.
Relative Strength Index (RSI): At about 56, it indicates moderate momentum, neither overbought nor oversold.
MACD: The MACD line hovers close to the signal line with signs of a slight bullish crossover, pointing to potential positive momentum.
Support and Resistance: Strong support clusters near $3.60 and $3.70; resistance is targeted at $4.15 and $4.20 levels.
Bollinger Bands: Bands remain relatively tight, indicating reduced volatility and possible buildup to a breakout.
These combined indicators suggest Polkadot is in a consolidation phase with the possibility of an upward move if resistance breaks.
Top 5 Chart Indicators Analysis for DOT
The crucial technical indicators reveal mixed signals with a lean towards cautious optimism:Moving Averages (20-day and 50-day SMA): DOT is trading just above the 50-day SMA but below the 20-day, signaling some consolidation with upward bias.
Relative Strength Index (RSI): At about 56, it indicates moderate momentum, neither overbought nor oversold.
MACD: The MACD line hovers close to the signal line with signs of a slight bullish crossover, pointing to potential positive momentum.
Support and Resistance: Strong support clusters near $3.60 and $3.70; resistance is targeted at $4.15 and $4.20 levels.
Bollinger Bands: Bands remain relatively tight, indicating reduced volatility and possible buildup to a breakout.
These combined indicators suggest Polkadot is in a consolidation phase with the possibility of an upward move if resistance breaks.
#3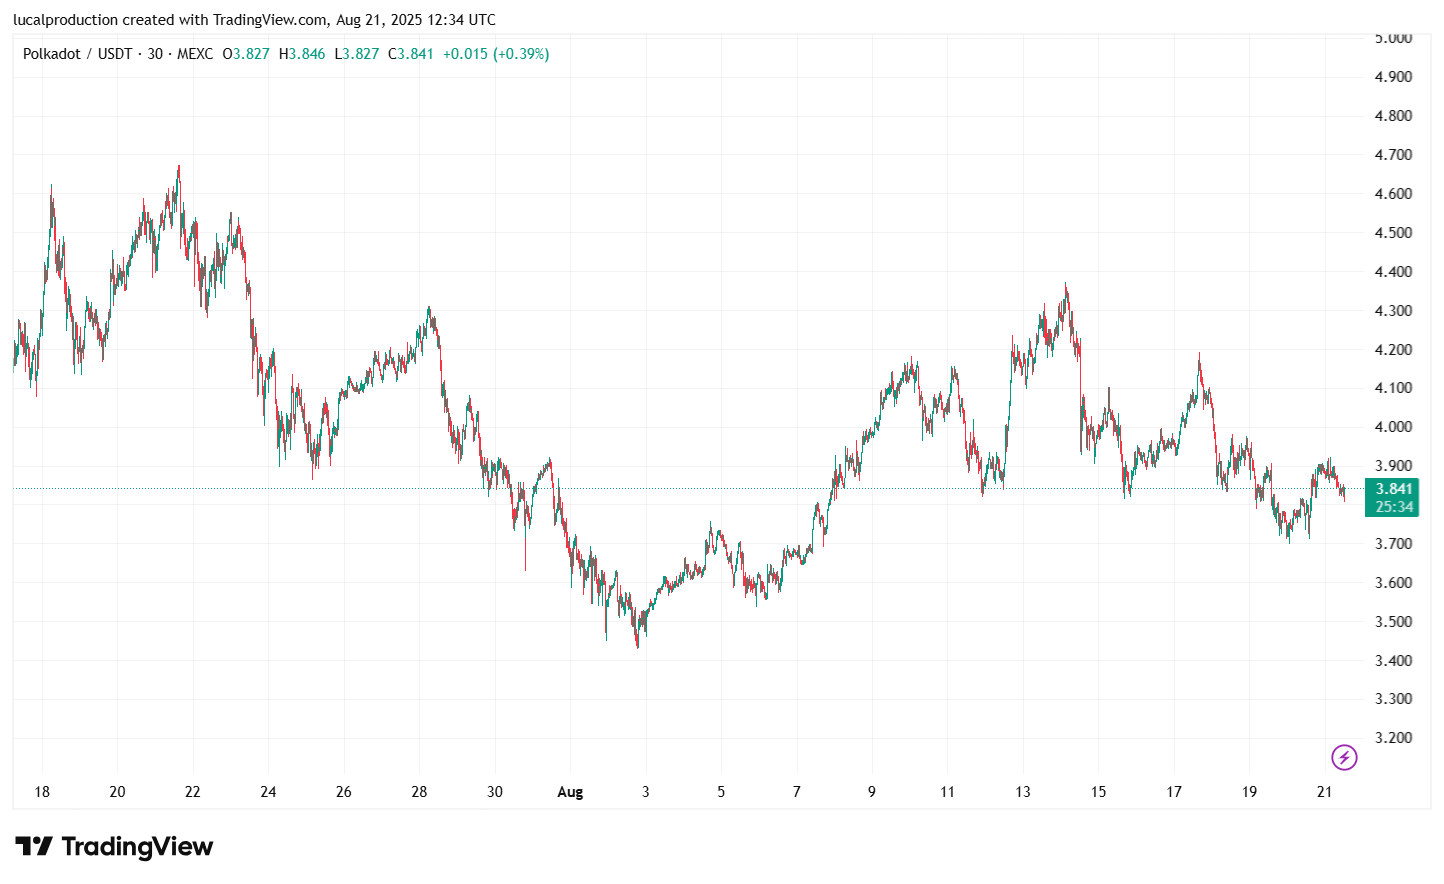 Polkadot’s fundamentals are being bolstered by active development and market sentiment:
Polkadot recently saw a rise in parachain auctions delivering innovative cross-chain projects, enhancing the network’s value proposition.
The staking rate on the Polkadot network remains high, attracting long-term investors focused on network security and returns.
Institutional buyers have maintained steady crypto exposure to Polkadot, reflected in consistent buying volumes.
Governance upgrades aiming for more scalable and decentralized processes are underway, promising improved network efficiency.
Despite broader crypto sector volatility, Polkadot’s interoperability focus keeps investor interest solid.
News and Ecosystem Updates Supporting Polkadot
Polkadot’s fundamentals are being bolstered by active development and market sentiment:Polkadot recently saw a rise in parachain auctions delivering innovative cross-chain projects, enhancing the network’s value proposition.
The staking rate on the Polkadot network remains high, attracting long-term investors focused on network security and returns.
Institutional buyers have maintained steady crypto exposure to Polkadot, reflected in consistent buying volumes.
Governance upgrades aiming for more scalable and decentralized processes are underway, promising improved network efficiency.
Despite broader crypto sector volatility, Polkadot’s interoperability focus keeps investor interest solid.
#4
Near-term forecasts foresee DOT stabilizing between $3.60 and $4.15 through late August and September 2025.
Longer-term bullish targets in 2025 range between $5.00 and $7.00, dependent on successful ecosystem milestones.
Some bearish scenarios warn of dips below $3.50 on macroeconomic shocks or crypto market sell-offs.
Volume and momentum will be key to confirming a breakout above resistance levels.
Price Predictions and Expert Insights
Analysts offer a guarded but hopeful price outlook for DOT:Near-term forecasts foresee DOT stabilizing between $3.60 and $4.15 through late August and September 2025.
Longer-term bullish targets in 2025 range between $5.00 and $7.00, dependent on successful ecosystem milestones.
Some bearish scenarios warn of dips below $3.50 on macroeconomic shocks or crypto market sell-offs.
Volume and momentum will be key to confirming a breakout above resistance levels.
#5
Price is supported near $3.60–$3.70.
Key resistance at $4.15–$4.20 must be overcome for bullish momentum.
Moderate RSI and MACD indicate measured optimism.
Bollinger Bands suggest lower volatility ahead of possible price shift.
Watch volume for confirmation of new trends.
Summary of Technical Outlook for DOT
Polkadot is currently balancing between consolidation and potential breakout:Price is supported near $3.60–$3.70.
Key resistance at $4.15–$4.20 must be overcome for bullish momentum.
Moderate RSI and MACD indicate measured optimism.
Bollinger Bands suggest lower volatility ahead of possible price shift.
Watch volume for confirmation of new trends.
#6
Healthy ecosystem growth and staking activity.
Mixed but improving technical signals with consolidation favoring bulls.
Important resistance levels for price breakthrough.
Stable institutional interest amid crypto market fluctuations.
Analyst predictions supporting moderate price gains through 2025.
Key Takeaways
Polkadot’s outlook highlights:Healthy ecosystem growth and staking activity.
Mixed but improving technical signals with consolidation favoring bulls.
Important resistance levels for price breakthrough.
Stable institutional interest amid crypto market fluctuations.
Analyst predictions supporting moderate price gains through 2025.
#7
Disclaimer
The information provided is NOT financial advice. I am not a financial adviser, accountant or the like. This information is purely from my own due diligence and an expression of my thoughts, my opinions based on my personal experiences and the help from technology information gathering tools to indicate the movement of the market, coin or any relevant information which is human changed and reedited.Reactions
Reactions
1


