


This article delivers a thorough analysis of Bitcoin (BTC), utilizing five prominent technical indicators—Volume, MACD, RSI, Bollinger Bands, and Moving Averages—to evaluate its current trading status and future prospects. Integrating the latest market data with recent news about Bitcoin’s price action, institutional interest, and ecosystem developments, the article presents a comprehensive forecast for BTC through the end of 2025. It aims to guide investors with clear insights into Bitcoin’s potential trajectory amid ongoing volatility and macroeconomic influences.
#1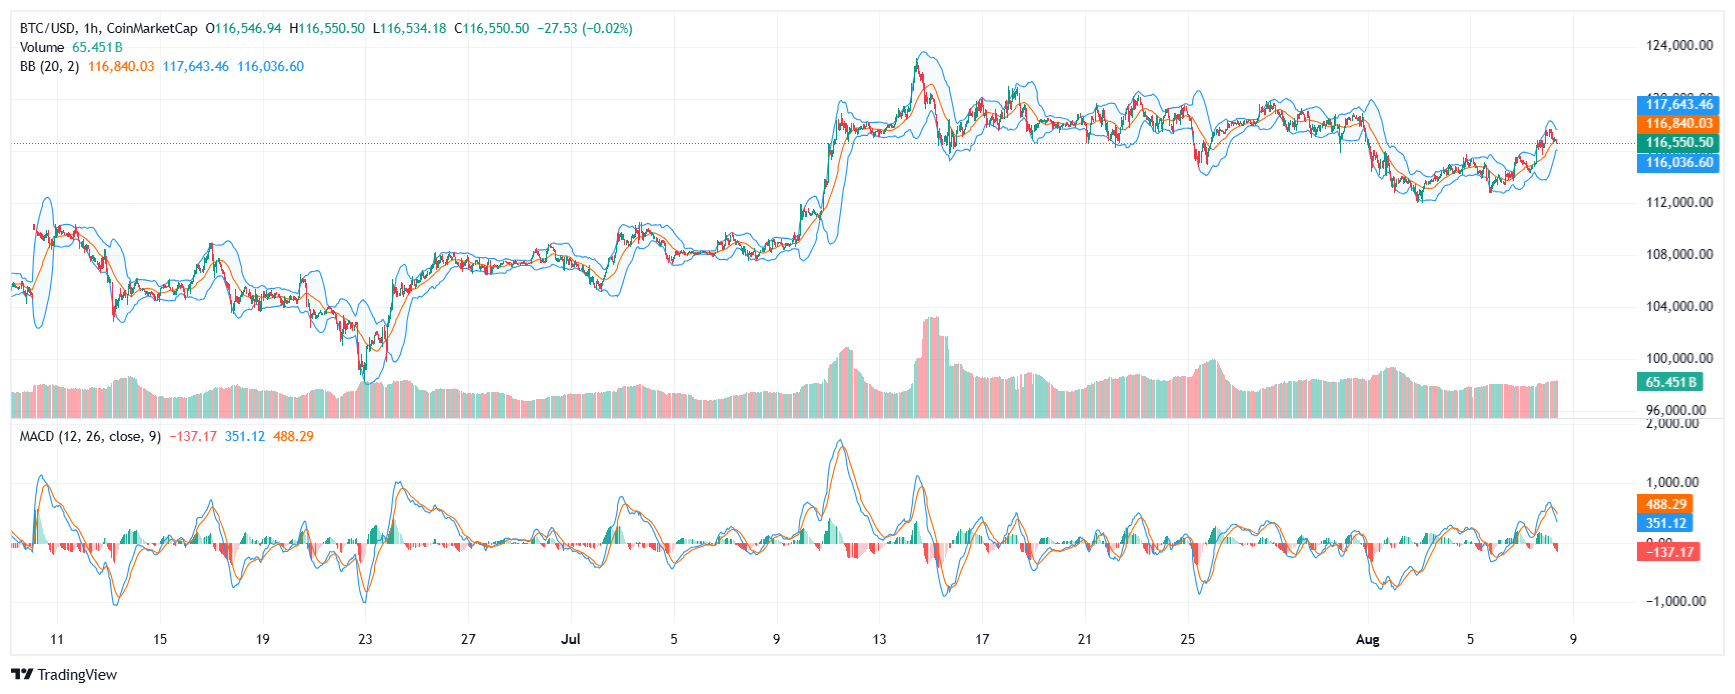 Bitcoin remains the dominant cryptocurrency with a market cap exceeding $2.27 trillion as of early August 2025.
Surpassing $114,000, Bitcoin recently showed bullish recovery after bouncing off its 50-day moving average, signaling renewed momentum.
Institutional accumulation and on-chain metrics indicate growing confidence, while mainstream adoption continues to progress with increasing transaction volumes.
However, Bitcoin faces potential short-term pullbacks amid global macroeconomic uncertainties and regulatory watchfulness, keeping traders cautious.
Positive sentiment surrounds targets near $120,000 to $124,000 if resistance levels break convincingly.
Overview of Bitcoin's Market Position and Recent News
Bitcoin remains the dominant cryptocurrency with a market cap exceeding $2.27 trillion as of early August 2025.Surpassing $114,000, Bitcoin recently showed bullish recovery after bouncing off its 50-day moving average, signaling renewed momentum.
Institutional accumulation and on-chain metrics indicate growing confidence, while mainstream adoption continues to progress with increasing transaction volumes.
However, Bitcoin faces potential short-term pullbacks amid global macroeconomic uncertainties and regulatory watchfulness, keeping traders cautious.
Positive sentiment surrounds targets near $120,000 to $124,000 if resistance levels break convincingly.
#2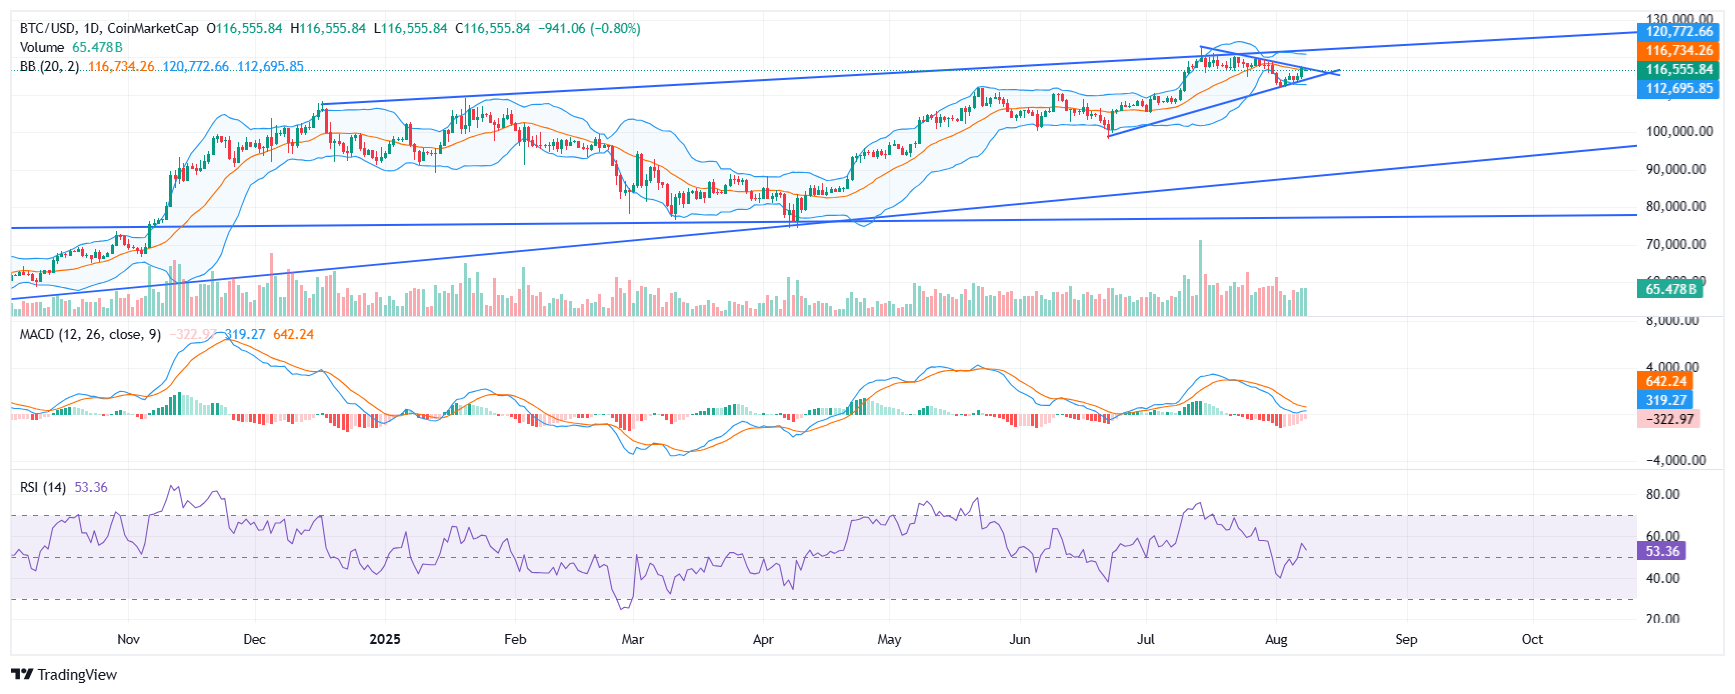 Current Bitcoin price hovers around $114,000. A breakdown of technical indicators follows:
Volume: Trading volume rose over 13%, showing increasing investor engagement and liquidity without extreme volatility.
MACD (Moving Average Convergence Divergence): MACD line is close to the signal line, suggesting a neutral to slight bullish bias but no strong impulse yet.
RSI (Relative Strength Index): Around 55-56, the RSI signals neither overbought nor oversold conditions, indicating balanced market sentiment.
Bollinger Bands: Price remains in the middle band range, indicative of moderate volatility and readiness for potential breakout or retracement.
Moving Averages (50-day and 200-day): The 50-day moving average remains below price but is trending upward, while the 200-day moving average is also rising, reflecting medium- to long-term bullish trends.
Together, these indicators portray a market consolidating near key levels with cautious optimism, balancing upside opportunity against possible short-term corrective moves.
Technical Analysis Using Top 5 Indicators for Bitcoin
Current Bitcoin price hovers around $114,000. A breakdown of technical indicators follows:Volume: Trading volume rose over 13%, showing increasing investor engagement and liquidity without extreme volatility.
MACD (Moving Average Convergence Divergence): MACD line is close to the signal line, suggesting a neutral to slight bullish bias but no strong impulse yet.
RSI (Relative Strength Index): Around 55-56, the RSI signals neither overbought nor oversold conditions, indicating balanced market sentiment.
Bollinger Bands: Price remains in the middle band range, indicative of moderate volatility and readiness for potential breakout or retracement.
Moving Averages (50-day and 200-day): The 50-day moving average remains below price but is trending upward, while the 200-day moving average is also rising, reflecting medium- to long-term bullish trends.
Together, these indicators portray a market consolidating near key levels with cautious optimism, balancing upside opportunity against possible short-term corrective moves.
#3 Analysts forecast Bitcoin price to fluctuate between $110,000 and $120,000 during August 2025, with projections for a potential rise to $124,000 if momentum sustains.
Moderate volatility of ±10% is expected amid periodic pullbacks influenced by macroeconomic factors. Price could reach highs near $118,000 to $120,000 into early fall.
However, caution is advised due to bearish divergences and resistance levels around $116,000-$117,000. Overall, long-term bullish indicators remain intact, supported by steady accumulation from institutional and retail investors.
Bitcoin Price Forecast and Market Sentiment August to December 2025
Analysts forecast Bitcoin price to fluctuate between $110,000 and $120,000 during August 2025, with projections for a potential rise to $124,000 if momentum sustains.Moderate volatility of ±10% is expected amid periodic pullbacks influenced by macroeconomic factors. Price could reach highs near $118,000 to $120,000 into early fall.
However, caution is advised due to bearish divergences and resistance levels around $116,000-$117,000. Overall, long-term bullish indicators remain intact, supported by steady accumulation from institutional and retail investors.
#4 Institutional investors continue to increase Bitcoin holdings, bolstering confidence in the asset’s store-of-value narrative. Several hedge funds and corporate treasuries have renewed exposure amid favorable regulatory signals.
Additionally, innovations like the Lightning Network improvements facilitate faster and cheaper transactions.
Regulatory developments remain closely monitored, as they impact market confidence. Bitcoin’s ecosystem strengthening, alongside growing adoption in payments and custody solutions, supports a positive outlook for continued growth despite potential market corrections.
Recent News Impacting Bitcoin’s Outlook
Institutional investors continue to increase Bitcoin holdings, bolstering confidence in the asset’s store-of-value narrative. Several hedge funds and corporate treasuries have renewed exposure amid favorable regulatory signals.Additionally, innovations like the Lightning Network improvements facilitate faster and cheaper transactions.
Regulatory developments remain closely monitored, as they impact market confidence. Bitcoin’s ecosystem strengthening, alongside growing adoption in payments and custody solutions, supports a positive outlook for continued growth despite potential market corrections.
#5
Volume +13% increase Solid investor interest and liquidity
MACD Neutral to slight bullish Momentum tentative, awaiting breakout
RSI ~55-56 (Neutral) Balanced market sentiment
Bollinger Bands Middle range Moderate volatility, breakout potential
Moving Averages 50-day and 200-day rising Medium- to long-term bullish trend intact
Market Chart Summary Table for Bitcoin (August 2025)
Price ~$116,000 Current consolidation near resistanceVolume +13% increase Solid investor interest and liquidity
MACD Neutral to slight bullish Momentum tentative, awaiting breakout
RSI ~55-56 (Neutral) Balanced market sentiment
Bollinger Bands Middle range Moderate volatility, breakout potential
Moving Averages 50-day and 200-day rising Medium- to long-term bullish trend intact
#6
Volume and momentum indicators present a balanced market sentiment poised between gains and pullbacks.
Strong institutional interest and technological innovation bolster long-term positive outlook.
Resistance near $116,000-$117,000 is key to watch for breakout confirmation.
Market volatility remains a factor, so prudent risk management is advisable.
Key Takeaways for Investors
Bitcoin shows signs of recovery and consolidation around $114,000 with medium-term bullish trends.Volume and momentum indicators present a balanced market sentiment poised between gains and pullbacks.
Strong institutional interest and technological innovation bolster long-term positive outlook.
Resistance near $116,000-$117,000 is key to watch for breakout confirmation.
Market volatility remains a factor, so prudent risk management is advisable.
#7
Bitcoin is consolidating with neutral to slightly bullish momentum near $114,000.
What do volume and MACD indicate?
Volume growth shows investor interest; MACD suggests cautious optimism without strong momentum.
What is the near-term price forecast?
Expected to trade between $110,000 and $120,000 in August, with potential to reach $124,000.
Are there any significant risks?
Possible pullbacks exist due to resistance levels and macroeconomic uncertainties.
Is Bitcoin a good long-term investment?
Strong fundamentals and institutional adoption support a positive long-term outlook, though volatility should be managed.
Frequently Asked Questions (FAQ)
What is Bitcoin’s current trend?Bitcoin is consolidating with neutral to slightly bullish momentum near $114,000.
What do volume and MACD indicate?
Volume growth shows investor interest; MACD suggests cautious optimism without strong momentum.
What is the near-term price forecast?
Expected to trade between $110,000 and $120,000 in August, with potential to reach $124,000.
Are there any significant risks?
Possible pullbacks exist due to resistance levels and macroeconomic uncertainties.
Is Bitcoin a good long-term investment?
Strong fundamentals and institutional adoption support a positive long-term outlook, though volatility should be managed.
Reactions
Reactions
2


